Loading and processing data from particle simulations in Aspherix and LIGGGHTS
Introduction
When performing bulk solids simulations or simulations of fluid-solid systems using methods like DEM or CFD-DEM, data needs to be extracted from simulation files for further processing. LIGGGHTS and Aspherix use versions of the VTK file format for use with ParaView for visualization.
In this document, I want to share a few snippets for loading simulation data that I developed during my PhD thesis, and show how to calculate simple quantities from this data in Python.
Setting up a Miniconda environment for pyvista
I can recommend using the PyVista library for reading data into python for processing.
Getting pyvista and vtk to play nice with Python, however, is a challenge. Miniconda helps here by making sure that all required dependencies are installed in compatible versions:
conda create -n postproc python pyvista pandas scipy notebook meshio ipykernel seaborn -c conda-forgeLoading single data files
No matter whether we want to analyze a single output file or an entire series, a function for reading single files is neccessary.
LIGGGHTS and legacy Aspherix
When using a dump custom/vtk and using a file ending of .vtp or .vtk, pyvista can directly read the dataset.
import pyvista as pv

my_data = pv.read("dump/dump.100000.vtp")
Aspherix
Aspherix’ output_settings writes dumps as a collective of files that need to be read and combined.
import pandas as pd
import pyvista as pv
import xml.etree.ElementTree as ET
from pathlib import Path


def read_vtm(path_to_vtm, combine_blocks=True):
    path_to_vtm = Path(path_to_vtm)
    root_node = ET.parse(str(path_to_vtm)).getroot()
    targets = [
        str(path_to_vtm.parent / x.attrib["file"])
        for x in root_node.findall(".//*[@name='Particles']/DataSet")
        if "file" in x.attrib
    ]
    uncombined = [pv.read(x) for x in targets]
    if combine_blocks:
        while len(uncombined) > 1:
            tmp = []
            odd_one = False
            while len(uncombined) > 1:
                tmp.append([uncombined.pop(), uncombined.pop()])
            if len(uncombined) == 1:
                odd_one = uncombined.pop()
            uncombined = [x.merge(y) for x, y in tmp]
            if odd_one:
                uncombined.append(odd_one)
        return uncombined[0]
    return uncombined

my_data = read_vtm("dump/dump.10000.vtm")
Converting PyVista data into pandas DataFrames
While pyvista has lots of methods for processing data, I am more familiar with pandas and typically convert the data directly into the dataframe format.
Its own output, however, gives an easy way to look at your data:
my_data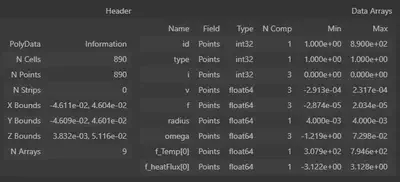
I wrote a function that performs this conversion:
import pandas as pd

def pv_to_df(pv_data, fields_to_copy=["x", "y", "z", "radius", "id"]):
    XYZ_POS = {"x": 0, "y": 1, "z": 2}
    df = pd.DataFrame()
    for field in fields_to_copy:
        if field in XYZ_POS.keys():
            df[field] = pv_data.points[:, XYZ_POS[field]]
            continue
        df[field] = pv_data[field]
    return df
This allows for direct analysis like this:
import matplotlib.pyplot as plt

df = pv_to_df(my_data, fields_to_copy=["x", "y", "z", "radius", "id", 'f_Temp[0]'])

fig, ax = plt.subplots(ncols=2)
df.hist('z', ax=ax[0], density=True, bins=20)
df.hist('f_Temp[0]', ax=ax[1], density=True, bins=20)
Extracting time series from dumps
More often than not, the change of a quantity over time is of interest. We can simply apply the above function to a series of files in a dump folder:
import numpy as np
get_timestep = lambda p: str(p).split(".")[-2]

def order_dumps(filelist, timestep=None):
    df = pd.DataFrame({
        'timestep': np.array([get_timestep(x) for x in filelist], dtype=int),
        'path': filelist,
    })
    if timestep:
        df['time'] = df['timestep'] * timestep
    return df.sort_values('timestep')
Small simulations: load all data
For small simulations, loading all data into a single dataframe is rather convenient:
from pathlib import Path
def read_data(x):
    df = pv_to_df(
        pv.read(x.path),
        fields_to_copy=["x", "y", "z", "radius", "id", 'f_Temp[0]']
    )
    df['time'] = x.time
    return df

files = order_dumps(list(Path("./post").glob("dump.*.vtp")), timestep=1e-4)
particle_data = pd.concat([read_data(x) for x in files.itertuples()])mean(), min(), max() or quantile(which_quantile) can be used:
fig, (ax1, ax2) = plt.subplots(ncols=2, sharex=True)

particle_data.groupby('time').mean()['f_Temp[0]'].plot(ax=ax1)
particle_data.groupby('time').mean()['z'].plot(ax=ax2)
ax1.set(ylabel='mean temperature')
ax2.set(ylabel='mean z coordinate')
fig.tight_layout()
Large simulations: iterate over all timesteps
For larger simulations, where not all data fits into memory at the same time, one may just read a file at a time, process the data and then collect the results:
from pathlib import Path
def process_step(x):
    df = pv_to_df(
        pv.read(x.path),
        fields_to_copy=["x", "y", "z", "radius", "id", 'f_Temp[0]']
    )

    this_result = pd.DataFrame({
        'time': [x.time],
        'mean_temperature': [df['f_Temp[0]'].mean()],
        'mean_z': [df['z'].mean()],
    })
    return df

files = order_dumps(list(Path("./post").glob("dump.*.vtp")), timestep=1e-4)
results = pd.concat([process_step(x) for x in files.itertuples()]).reset_index(drop=True)
This is equivalent to the computation performed above, but without the need to keep all of the particle data in memory simultaneously.